
- Google Search Console, GA4 and Looker Studio give you everything you need for solid SEO reporting at no cost.
- Looker Studio connects directly to both and lets you build a dynamic dashboard without writing any code.
- The setup covers clicks, impressions, CTR, sessions, top queries and a high impression/low CTR filter. These are the metrics that actually matter in a weekly review.
I’m not going to tell you paid SEO reporting tools aren’t worth it. Some of them are genuinely good, and more data means more proof to form a strategy.
But when I sat down and thought about what I actually needed:
- A clear view of how my content was performing
- Not another monthly subscription eating into the budget
I realised I already had access to everything I needed.
This is how I built an SEO reporting setup that costs nothing and gives me a dynamic dashboard I can open (impress your department head, confuse your friends).
Why free tools are enough (for most people)
Paid reporting tools earn their keep at scale. If you’re managing dozens of clients, running complex rank tracking across thousands of keywords, it’s worth paying for.
But if you’re running a single site (like this humble blog) or even a handful, the data you genuinely need for good SEO decisions already lives in two places Google gives you for free: Search Console and GA4. The question isn’t whether the data exists. It’s whether you can see it clearly.
That’s where Looker Studio comes in. It’s Google’s free dashboarding tool, and it connects directly to both (and more). Most people don’t realise it exists, or assume it’s complicated. It’s not.
The stack
The three tools, all free:
- Google Search Console
- Clicks, impressions, click-through rate, and average position by page and query. This is your search visibility data.
- Google Analytics 4
- Sessions, engagement rate, events, and conversions. This is your on-site behaviour data.
- Looker Studio
- Connects to both, lets you build visual dashboards without writing a line of code, and shares easily with clients or teammates.
- A quick note: Looker Studio is the free tool (formerly called Google Data Studio). It’s separate from Looker, Google’s enterprise BI platform (slightly confusing I know).
That’s it. Nothing to install, nothing to pay for.
Building the Looker Studio dashboard
Step 1: Get access to Looker Studio
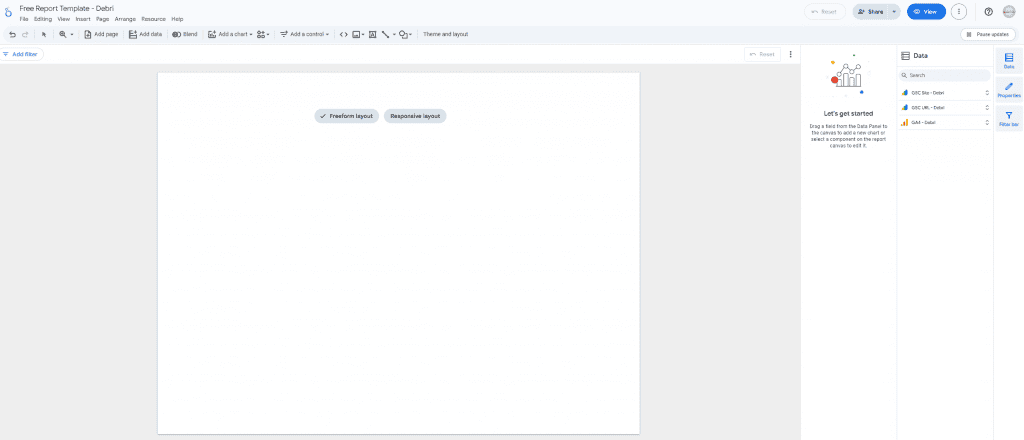
Go to lookerstudio.google.com. Sign in with the same Google account that has access to your Search Console and GA4 properties. Create a new report.
You can take the time to choose or customise a theme, set the size of each page / slide etc. But you can work through that on your own and create a template that suits you best.
Also for your first Looker Studio report I advise to start off with the “Freeform layout” option as that will give you full control over layout and is what I’ll be using throughout. (The “Responsive layout” option is recommended when you’re looking to embed reports within websites)
Note that for every element you click on you will see Setup and Style sections appear on the right so that you can customise that element in any way you wish. I’ll be making use of some of the Setup options during the rest of this process.
Step 2: Connect Google Search Console
In the new report, click Add data. Search for “Search Console” and select the Google Search Console connector. Choose your property and select the Site Impression table, which this gives you query-level data including impressions, clicks, CTR, and position.
Add a second Search Console data source using the URL Impression table. This gives you the same metrics broken down by page rather than query.
Note: take the time here to edit the names of your data sources within Looker Studio as the two GSC sources will have exactly the same name if you don’t (and also adjust the GA4 connection’s name just to fit into a standard naming convention).
Step 3: Connect GA4
Add another data source and select the Google Analytics connector. Choose your GA4 property. This gives you access to sessions, users, engagement rate, events, and any conversion events you’ve set up.
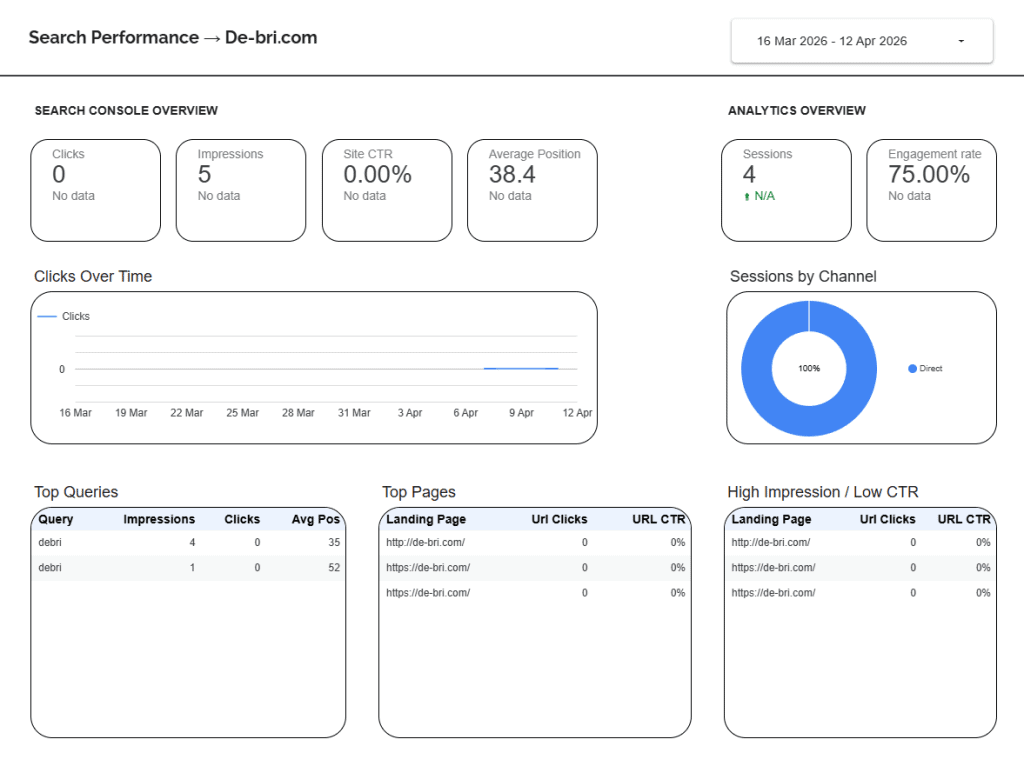
Step 4: Build the core metrics overview
Start with a scorecard row at the top of your dashboard. By using the Insert menu option, add individual scorecard components for:
- Total clicks (from GSC)
- Total impressions (from GSC)
- Average CTR (from GSC)
- Average position (from GSC)
- Sessions (from GA4)
- Engagement rate (from GA4)
These give you a quick health check at a glance.
Step 5: Add a date range control
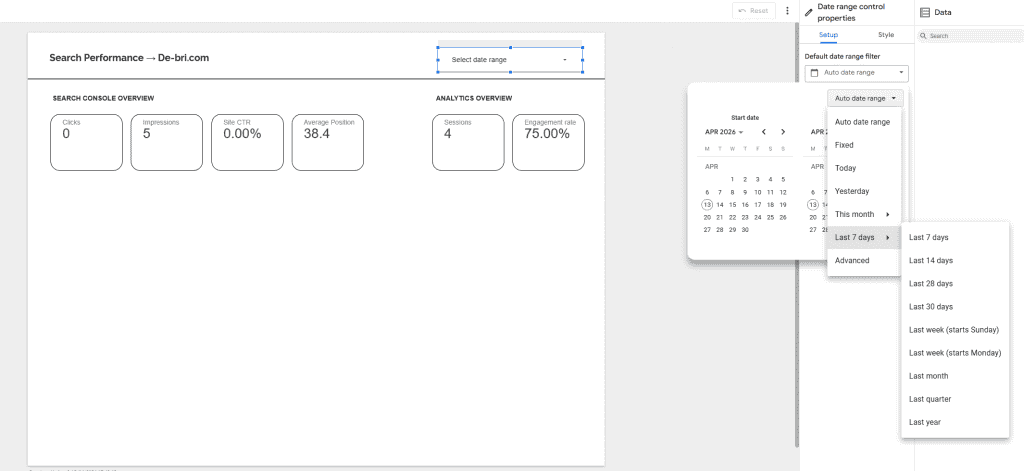
Add a date range control (again via Insert) at the top of the report and set it to apply to all charts. You can set a dynamic data range here, but I’d recommend navigating to the Setup settings to the right to pick a range that suits you, for example the last 7 days, last 28 days, last 3 months or custom ranges without rebuilding anything.
Step 6: Add your key charts
- Clicks over time
- A simple line chart using GSC data, with date on the X axis and clicks on the Y axis. Useful for spotting trends and seasonal patterns.
- Sessions by channel
- From GA4, broken down by session source/medium. This puts your organic traffic in context alongside direct, social, and referral.
- Top queries
- A table showing your top search queries by clicks, with impressions, CTR, and average position alongside. Sort by clicks descending by default, but the ability to re-sort by position helps you find pages stuck on page two.
- Top pages
- The same table but using the URL Impression data source, showing which pages are driving the most search traffic.
- High Impression / Low CTR
- To make this table useful, you’ll want to add a filter so it only surfaces pages with high impressions but a low CTR or else it’ll just mirror your Top Pages table.
- Click on the table, open the filter settings within the Setup section, and add a filter for Impressions greater than a threshold you set (something like 100 or 500 depending on your site’s scale), and URL CTR less than, say, 3%. Adjust both numbers based on your own data as the goal is to surface pages that are appearing in search but not getting clicked, which usually points to a URL that probably needs a better title or meta description.
Step 7: Apply a date comparison
In your scorecard settings, enable the comparison date range and set it to the previous period. This adds a small indicator to each metric showing whether you’re up or down, useful for a quick weekly review.
Step 8: Share or schedule
Looker Studio reports are shareable via link, the same way you’d share a Google Doc. You can set up automated email delivery by going to File > Schedule delivery and set a weekly or monthly email with a PDF snapshot of the report.
What this dashboard tells you
Once it’s set up, the report gives you a clear answer to the questions that actually matter in an SEO review:
- Are clicks trending in the right direction?
- Which queries are driving traffic and are there opportunities with high impressions but low CTR?
- Which pages are performing, and which have strong impressions but weak clicks (could point to a title or meta description problem)?
- Is organic traffic growing as a share of overall sessions?
No paid tool required. Just the right data, in a format you’ll actually use.
First Looker Studio report? There’s more you can do with it. From custom styling (brand colours and logos) to adding filters (limit specific elements or pages to organic traffic only) and advanced techniques like adding custom metrics and blending data sources.
Where this can go next
Once this is set up and you want to go deeper, the next step is pulling GSC data directly via the API and running it through a script (or having Claude summarise it for you).
The GSC interface caps you at 1000 rows. Looker Studio already gets you past that. But if you want to pull large historical datasets or automate the analysis entirely, the API is the next step.
It’s a more involved setup and worth a separate post (coming soon). Looker Studio covers everything most people actually need though, and the setup takes an afternoon.
If you build this and something doesn’t work the way I’ve described, Search Console and GA4 update their interfaces fairly regularly so the connectors and menu labels may have shifted slightly. The core structure holds even if the labels move.