
I built a WordPress website with a Core Web Vitals performance score of 40. Embarrassing? Yes. A stain on my reputation? Maybe. Impossible to fix? Definitely not.
- A performance score of 40 is fixable as my three targeted changes took mobile from 40 to 66.
- Font loading and image dimensions were the biggest culprits, not plugins or theme bloat.
- PageSpeed Insights is a diagnostic tool, not a definitive score. Real user data from CrUX is what Google actually uses.
How do you test Core Web Vitals?
If you want to speed up your WordPress site, understanding where you’re starting from is the first step. Site speed is an important ranking signal for Google (alongside newer factors like how AI search engines evaluate your content). Because why would they recommend a slow or unstable website to their users?
Google uses a system of metrics to score site performance called Core Web Vitals. And the easiest way for you to see those scores is with a free tool called PageSpeed Insights. You can analyse any URL, get a performance score and data about the specific issues affecting performance so that you can pass that on to your developer to review and make relevant improvements.
PageSpeed Insights is a solid free tool, but consider that this is effectively “lab data”. It takes the URL you supplied and tests it within a controlled environment (throttled connection speed, a specific device).
If you want to go deeper before running performance tests, a pre-launch site audit is a useful first step to rule out any structural issues before you start chasing scores.
Are PageSpeed Insights scores accurate?
Yes but not as specific to your site as you’d like. So I mentioned these tests run in a controlled environment. A more accurate assessment of your site performance can be seen in the Chrome User Experience Report (CrUX), which is Google’s data of the actual page load experiences from your real users visiting your site.
So why am I not using that real data to check for performance issues? Because my site is still brand new, and it needs enough traffic so the CrUX can generate that significant data for me. But that doesn’t mean that PageSpeed Insights is not useful.
While Google takes into account the actual performance metrics via the CrUX data to compile their search result recommendations, the lab data from PageSpeed Insights acts as a diagnostic tool so you can apply fixes before your site gets traction.
Look at your issues now, have them all fixed up and be in the best possible position when you start getting that real data.
What were my baseline scores?
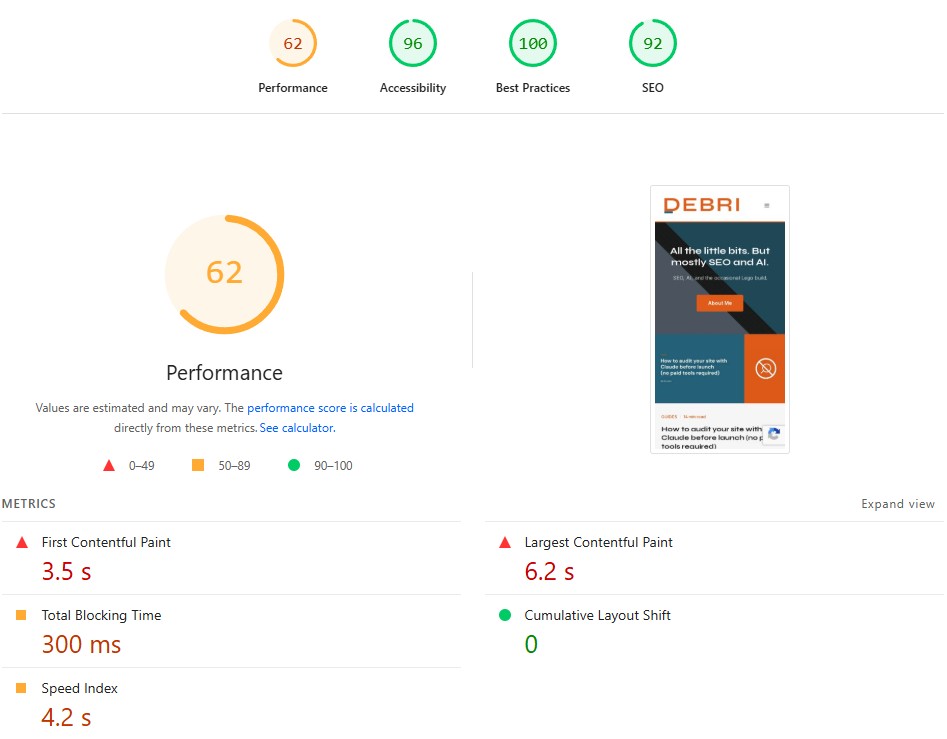
The results from my initial testing were… quite dismal. I built this site with performance in mind, choosing a lightweight WordPress theme with minimal plugins and what I thought were small structural adjustments.
| Page | Mobile Results | Desktop Results |
|---|---|---|
| Home Page | 40 | 47 |
WordPress site performance scores can be notoriously bad but that’s down to how they were built and expanded on. If your site is cobbled together with 30+ plugins to add various functionalities, you’re going to have a bad time.
Let’s quickly look at where those scores of mine were calculated. From analysing a URL, PageSpeed Insights (PSI) will output an overall performance score (the 40 and 47 I scored above) along with scores for Accessibility, Best Practices and SEO (all scored out of a maximum of 100). I’m going to focus on that Performance Score, and it’s calculated from a few different metrics:
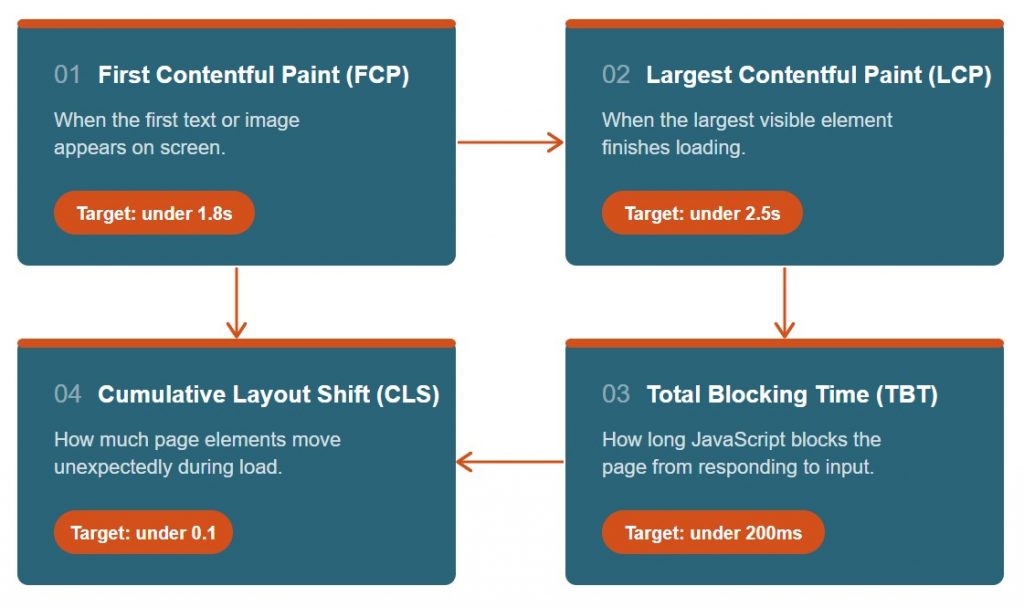
Overall performance scores are an excellent guide as to how your page is performing, but looking into each of the four main metrics is where you’re going to be spending most of your time. One poor metric can significantly affect your overall score.
As expected, my desktop performance was better than mobile because as your site structure and layout is doing a lot more work to make it presentable on smaller screens. With both desktop and mobile scoring under 50 (still embarrassing) the site needed work. These were my biggest issues:
- Cumulative Layout Shift (CLS)
- Font loading and hero section
- Total Blocking Time (TBT)
- JavaScript blocking
- Largest Contentful Paint (LCP) from render-blocking resources
What did I change immediately?
This test was done immediately on launch, I wanted to give the site an initial boost and then circle back later for further improvements. After all, this whole site is an experiment and we’re working through all the issues together.
Issue 1 – Google Fonts
Oddly, the biggest improvement was all down to how I loaded fonts. I had picked two Google Fonts to use across my site, and those were taking too long to load and affecting my layout.
Solution:
- I set Google Fonts to render my text immediately to a fallback font instead of waiting for my custom fonts to load
- Technical: I set generate-google-fonts in my functions.php to change
font-display: blocktofont-display: swap
Issue 2 – Featured images on posts
My featured image posts on category pages did not have specific width and height values assigned. So when my browser encountered those it didn’t know how big the images were going to be, so it loaded the surrounding content first. When the images then fully loaded, the layout shifted around to accommodate the images.
Solution:
- I set those width and height attributes for the category page template, so that my browser reserved the exact space needed for images before they loaded
- Technical: Explicit width and height attributes were added to the archive.php template via Claude Code in the child theme.
Issue 3 – Brevo font-face
Fonts, who knew they could be so problematic. Back to the same issue we experienced earlier, but this time it was the fonts used for my newsletter signup form in the footer.
Solution:
- Again I set a fallback font to load immediately instead of waiting for the custom font
- Technical: I updated
font-display: blocktofont-display: swap
Did the scores improve?
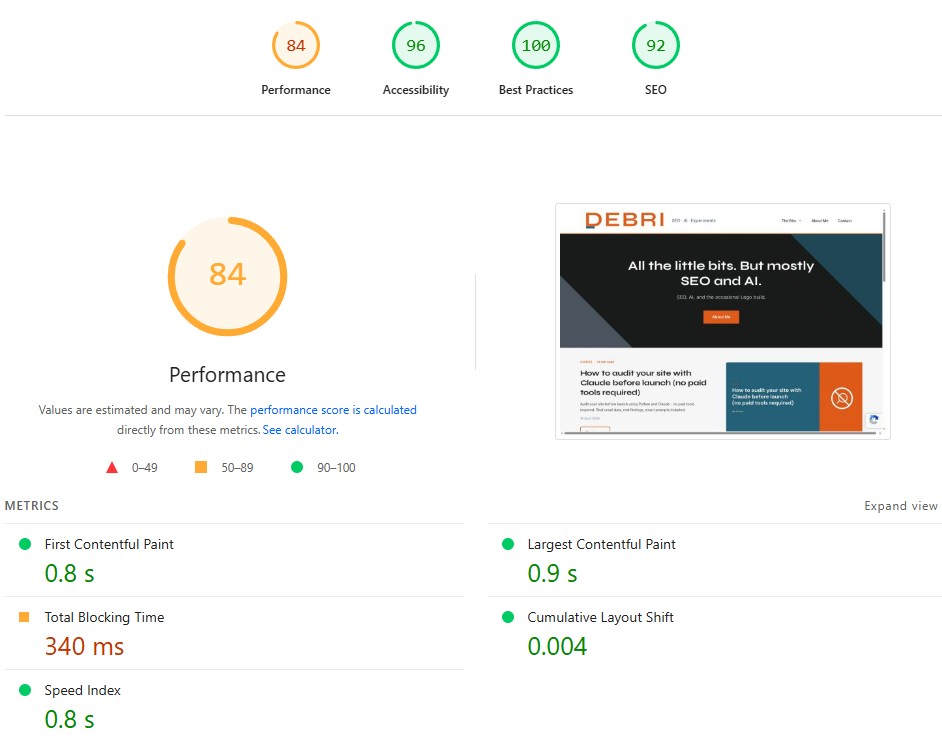
The results from my second testing session were better but yielded a slightly strange result. My improvements propelled mobile performance so far that it outscored the desktop result.
| Page | Mobile Results | Desktop Results |
|---|---|---|
| Home Page | 40 → 66 | 47 → 56 |
Mobile overtaking desktop was unexpected, but it makes sense once you look at what the fixes actually targeted.
I made progress but those fixes skewed towards mobile performance. This is not a bad thing since Google prioritises mobile traffic, but my initial goal is to get both performance scores above 70. No man or device platform left behind.
So what worked? This was a clear win for the original CLS issues.
With no more guesses around how much space a featured image would use and saving time on fonts loading via the swap directive, the layout became a lot more stable. This also highlights how a single metric can affect your performance score.
For desktop, I had minimal issues within the more performance-based metrics like FCP and LCP. Good scores for those two metrics depend more on processing power and your connection speed. Where the page struggled was down to some visual instability with content moving around on the initial page load. My CLS score affected the overall score so much that it only marginally improved.
What still needs fixing?
After the second test I made further technical and structural improvements to the site like reworking the featured image formats for featured and sticky posts.
I did a quick check-in and these changes noticeably affected my performance scores.
Mobile performance is just about the same as a week ago (minor fluctuations are normal), but desktop performance was boosted significantly just by my visual site improvements (a happy accident).
As for mobile, LCP and FCP scores are still above the thresholds I want despite my initial fixes (that’s the next thing to tackle). The CLS score of 0 is worth noting, especially for a site that launched with a desktop CLS of 0.994. Getting that down to an acceptable level was the priority but reaching 0 was a bonus.
My desktop score jumping from 56 to 84 as a side effect of visual improvements is a useful reminder that performance and design aren’t always separate issues. Fixing how something looks can fix how it loads.
I’ll document the next round of fixes once I’ve worked through the remaining mobile issues. Hopefully at that point I’ll have CrUX data available which will give me a more accurate idea than just using the lab scores.
In the meantime, if you want to track how your own site is performing over time, I put together a free reporting setup using Google Search Console, GA4 and Looker Studio — no paid tools required.